Outcomes
 The Innovation, Monitoring, Learning and Communication Division of the CLP is responsible for collecting information to demonstrate the outcomes (impact) of the Programme for its core participant households. Data are collected from core participant households on a range of variables, with varying degrees of frequency, and presented in annual reports. During its second phase (2010-2016), the CLP will support 78,000 core participant households with a full package of support (click here for more information). These 78,000 households will be supported through up to six annual cohorts (or groups). The IMLC Division collects baseline data on each cohort and then monitors the progress from a sample of households over time e.g. asset status, nutrition status etc. To demonstrate outcomes, the CLP uses the pipeline control method whereby the status of new entrants (new cohorts) is compared to the status of earlier cohorts and any difference is termed an outcome. In addition, in 2011 the IMLC Division began collecting data from a sample of households who meet the CLP selection criteria but who will not receive support for another year. These households will receive support at a later date. The status of these households (termed control households) is being monitored alongside households that did receive support in 2011 and will therefore offer another method of assessing outcomes. The following graphs demonstrate some key outcomes from the CLP. Note both differences over time, as well as between cohorts. Click here for details about how we measure outcomes Click below, on the relevant categories, to visualise the different performance graphs.
Value of Productive Assets
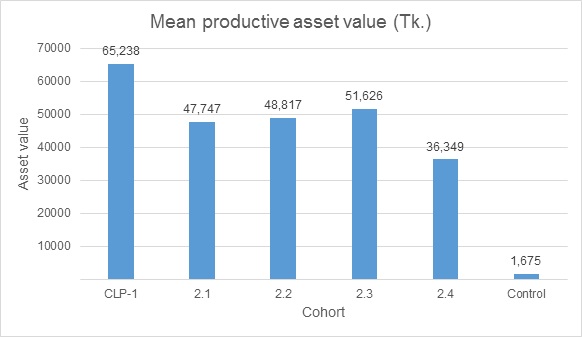 To monitor outcomes of the programme, the CLP collects data using a rolling baseline or pipeline control approach. This is where the baseline status of new, annual entrants, provides the basis against which one can measure the progress of earlier cohorts. This figure shows the mean value of productive assets for Cohort 2.1 between joining the CLP (2010) and 2013. This shows that the impact CLP has on mean productive asset values is sustainable.
Sources of Income
 Above figure shows the breakdown of the types of income source for households by cohort. There is a clear trend away from day labour, which constitutes the majority of income for the control group (83.7%), towards other forms of income. Day labour is replaced largely by income from the sale of livestock and livestock products, such as milk and manure, and secondly by agricultural production. This is important as it demonstrates that households are moving away from having one predominant income source to diversified income sources.
Consumption Expenditure
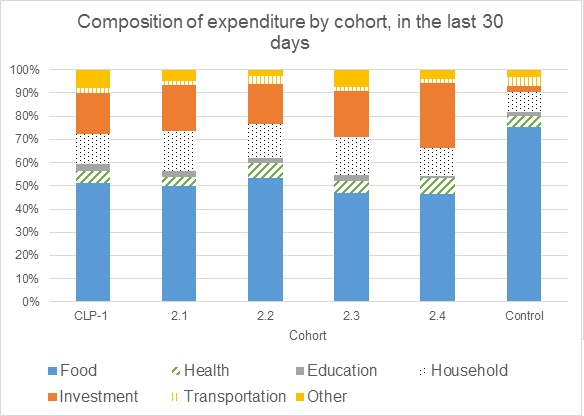 The largest proportion of household expenditure goes on food and this is consistent across all cohorts. In the last 30 days, 75.4% of the control group’s household expenditure was spent on food. For Cohort 2.4 households that are still part of CLP, this decreases substantially to 46.5% and continues to remain around this level as participants complete the Programme (Cohort 2.3). For cohorts that have left the Programme, data seems to fluctuate very slightly but stays around the 50% mark.
Food Consumption Score
The FCS is based on dietary diversity, food frequency and the nutritional importance of food groups consumed. This graph shows the proportion of households with acceptable FCSs for different cohorts, in the October 2012 and October 2013 surveys. The controls for each of the surveys (CLP 2.4 in 2012 and CLP 2.5 in 2013) had not received CLP support which explains why both report less than 10% households with acceptable FCSs, considerably less than cohorts who had received the CLP support package.
Food Frequency
This graph shows the proportion of HHs eating three or more meals per day (3MPD) for different cohorts in the October 2012 and October 2013 annual surveys. The percentage of HHs does not indicate the quality of the meals. In the graph CLP 2.4 is the control for 2012 and CLP 2.5 is the control for 2013. Both controls show less than 30% of HH taking 3 or more meals per day. All three cohorts that received CLP support have significantly higher percentages of HH eating 3MPD. This difference between the controls and the cohorts who received CLP support shows the CLP has a significant impact on the number of meals households consumed per day.
Food Expenditure
This graph shows that, in the October 2012 data, the control, 2.4, also has high percentages of HHs spending more than 70% of their income on food. CLP 2.3 and CLP 1 has significantly more HHs spending more than 70% of their income on food compared to the 2013 data. More hazards occurred in 2012 which would cause a reduction in the availability of food on the chars, increasing the price of food. HHs would then have to spend more to purchase food.
Access to Cattle
This figure shows the proportion of HHs with cattle, both owned and shared. CLP 2.4 is the control during the October 2012 survey and CLP 2.5 is the control during the October 2013 survey. During both the 2012 and 2013 surveys the proportion of control group households with cattle is relatively smaller than households who have received CLP support. The highest proportion of households in both years are the cohorts which most recently received CLP support. This proportion decreases the longer households have stopped receiving the CLP support package. This is expected: as CLP HHs grow in wealth, they diversify into other assets such as land.
Access to Agricultural Land
Access to a Sanitary Latrine
This figure shows the proportion of HHs with access to a sanitary latrine up to CLP standards. The control, CLP 2.5, has only 6.1% of HHs with access to a sanitary latrine. CLP 2.3, who at the time of the survey had finished receiving the full package of CLP support four months before the October 2013 survey, had 87.4% of HHs with access to a sanitary latrine up to CLP standards. CLP has a substantial impact on the access to sanitary latrines up to CLP standards though as CLP aims for every HH to have access to a sanitary latrine, this figure is expected to be higher. With regards to sustainability, the proportion of core participant HHs with access to a sanitary latrine in CLP 1 is 52.5%. The reason for latrines to be considered non-sanitary are water seals being broken.
Access to Improved Water Source
This figure shows the proportion of core participant HHs with access to a tube well up to CLP standards. Cohort 2.5, the control, has only 5.2% of HHs with access. This figure increases substantially to 42.8% for CLP 2.3, who completed receiving the full package of CLP support in June 2013, four months prior to the survey (October ’13). This may appear to be low but up to July 2013, the CLP’s policy on improved water was to install or upgrade tube wells where they could be accessed by more than five HHs, irrespective of whether the HHs were core participants or not. With regards to sustainability, 21.3% of CLP 1 core participant households reported having access to tube wells up to CLP standards.
Improved Hygiene Practices
In this figure results for CLP 1 showed that on average larger proportions of women, compared to CLP 2.3, were washing their hands at critical times. This shows that CLP’s impact is not only sustainable but seems to increase over time.
Percentage of Women Empowered
The figure shows that CLP has a significant impact on women’s empowerment. CLP measures women’s empowerment using an Empowerment Scorecard, comprising community-defined indicators of empowerment. If a woman scores five or over, she is considered to be empowered. According to the figure, women meeting five or more of CLP’s empowerment criteria are substantially higher (between 87-95%) than the control group (0.2%), who have not received CLP support.
Mean Empowerment Score
The CLP measures empowerment using a community-defined scorecard, which provides each woman with an Empowerment Score out of ten. The figure shows that, the mean empowerment score increases from 1.9 in the control group to between 6.4 and 7.5 for women who have received CLP support. As the criteria used to measure empowerment has been defined by people living on the chars and therefore the fact that such a large number of women meet this criteria is impressive.


 Visit Today : 178
 Total Visit : 279269
 Hits Today : 990
 Total Hits : 1941985
 Who's Online : 2